 Facebook
 Twitter
 Pinterest
 Copy Link
Q3 2018 Seattle-Eastside Real Estate Report


As Q3 comes to a close, 30-year fixed-rate mortgages are at their highest levels since April 2011—now averaging just above 4.7%. Even so, they are still far lower than their 30-year trendline. A 1% increase in mortgage interest rates decreases buying power by 10%. Or said differently, a 1% rate increase has the same net effect on monthly payment as a 10% increase in the sale price. That also means if prices fell 10% but rates went up 1% your payment would remain the same. This is a far bigger factor than most people consider.
Both first-time and move-up home buyers, with (finally!) more homes for sale to choose from and motivated by anticipated further rate hikes nipping at their heels, will feel the urgency to get moved and settled while they can still afford to do so.
Our market is likely to increasingly favor buyers as interest rates cause mortgage payments to increase uncomfortably beyond the affordability ceiling governed by personal income and wages. Properly-priced turn-key homes, and those in the most desirable settings, are still commanding very attractive prices and occasionally multiple offers. Everything else is seeing slowing appreciation and market softening. Strategic positioning, savvy marketing, and expert negotiation have never been so important as they are now.
Click or scroll down to find your area report:
Seattle | Eastside | Mercer Island | Condos | Waterfront
SEATTLE
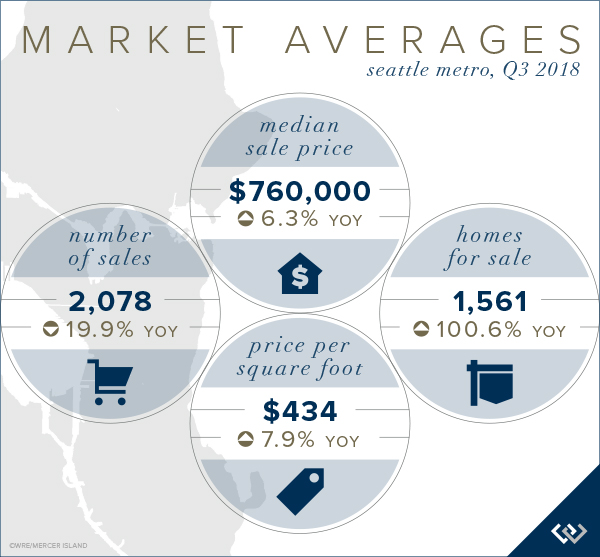
Seattle neighborhoods that were strongly bolstered by new construction and renovation saw the strongest sales activity, and not surprisingly, the greatest correlated price growth. Up 16.4% Q3 over Q3, the Queen Anne/Magnolia area led the charge, followed closely by Madison Park/Capitol Hill at 15.9%. Lake Forest Park/Kenmore at 13.2% and West Seattle at 12.5% also fared very well. Richmond Beach/Shoreline (6.2%), Ballard/Green Lake (4%), North Seattle (3.4%), and South Seattle (0.7%) saw notable price easing and contributed to rounding Seattle out to a modest 6.3% overall Q3 2017 to Q3 2018 median price increase.

Click here to view the complete report for a neighborhood by neighborhood breakdown of Average Sale Price, size, and number of homes sold.

EASTSIDE
Sharp increases in the number of homes for sale coupled with fewer international buyer transactions has caused a few ripples in the Eastside real estate market.
Mercer Island shows the strongest Q3 over Q3 increase in median sale price (see explanation below) at 19.7%, followed by Woodinville at 12.3% and Redmond at 12.2%. Bringing up the mid-section was West Bellevue at 8.0%, East of Lake Sammamish at 7.8%. Lagging the Eastside median increase of 7.3% were Kirkland (6.9%), South Eastside (2.0%), and East Bellevue (1.8%).

Click here for the full report and neighborhood-by-neighborhood statistics!

MERCER ISLAND
The Q3 median sale price was 19.7% higher than that of Q3 2017. However, its crucial to note that Q3 of 2017 was an anomaly with many land-value sales transacting at the low end of the price spectrum. The effect was that the median sale price was 10.2% lower than Q1 of that same year. Far fewer moderately priced homes transacted in Q3 of this year.
There were 89 sales in Q3 2017 and of those sales 45 were of homes priced below $1.5 million. Compare that to Q3 of 2018 with 74 sales, of which only 28 were priced below $1.5 million. The differential of sales between the two years was almost entirely composed of entry-level and land value home sales.
To further prove this, we looked at comparable homes sold this year and last (an approach like that of the Case-Schiller index). All things being roughly equal, the median sale price of that subset of homes increased only 9.0% from Q3 2017 to Q3 2018. This number is far more in alignment with what we have truly experienced in our market.

Click here to view the complete report for a neighborhood by neighborhood breakdown of Average Sale Price, size, and number of homes sold.

CONDOS – SEATTLE & EASTSIDE
Significant new construction projects underway or announced have dampened sales of existing condos somewhat, especially where they will directly compete with the new buildings. Neighborhood safety is being weighted more carefully against urban hip now more than ever. In Seattle, median sale prices of existing condos in Downtown Seattle/Belltown (-0.4%), Queen Anne/Magnolia (-4.8%), and North Seattle (-8.0%) have all decreased while surrounding areas have seen very strong to moderate Q3-Q3 increases. This quarter’s top contenders were Richmond Beach-Shoreline (30.3%), Ballard-Green Lake (26%), and West Seattle (25%).
On the Eastside, all areas except South Bellevue (-9.3%) saw considerable increases in the Q3 median sale price. East Bellevue (37.1%), Redmond (19.1%), and Kirkland (17.6%) topped the charts.
Check out all of these factoids and more in the full condo report.

WATERFRONT
The Eastside has been a hotbed of waterfront closed sale activity with as many Q3 sales as Seattle, Mercer Island, and Lake Sammamish combined. The number of active private waterfront listings for sale on the Eastside is down compared to Q3 of both 2015 and 2016, while the listing levels of Seattle, Mercer Island and Lake Sammamish waterfront properties remain about the same.
With only two closed sales in Q3, Months of Inventory—the number of homes for sale divided by the number of homes that sold—climbed dramatically on Mercer Island. Seattle, with four closed waterfront sales, saw a similar but more moderate increase. The Eastside and Lake Sammamish both experienced improvement in the Months of Inventory indicator.
The highest private waterfront Q3 sale was of a newer 6,570 square foot Hunts Point modern estate designed by Baylis Architects with 80 feet of no-bank waterfront on just over an acre of lush, private grounds for $18 million. The lowest sale was a 1,010 square feet westside Lake Sammamish 1958 beach house with 60 feet of waterfront on a shy ¼ acre lot with permitted approval for a new 5000 square foot home.
Check out the full Waterfront Report for a complete list of waterfront home sales by address and community.

ABOUT WINDERMERE MERCER ISLAND
We earn the trust and loyalty of our brokers and clients by doing real estate exceptionally well. The leader in our market, we deliver client-focused service in an authentic, collaborative and transparent manner and with the unmatched knowledge and expertise that comes from decades of experience.

© Copyright 2018, Windermere Real Estate/Mercer Island. Information and statistics derived from Northwest Multiple Listing Service and deemed accurate but not guaranteed.
2018 Football Schedules, Recipes, Tips & More…


Are you ready for some football? Scroll down for printable schedules, game-day recipes and awesome tailgating hacks…


Hosting friends for game day? I’ve got you covered with everything from easy snacks to bonafide Seattle-born favorites…
1. Easy Chicken Taquitos
So quick and delectable, you can skip the freezer aisle and go fresh instead! Click here for the recipe.

Photo courtesy of allrecipes.com
2. Seahawks Popcorn
Just the right mix of sweet and salty, this perfect treat is also a breeze to make. Click here to learn how.

Photo courtesy of twosisterscrafting.com
3. Just Good Chili
Coffee and cocoa powder? This is chili done Seattle-style, baby! Here’s the skinny.
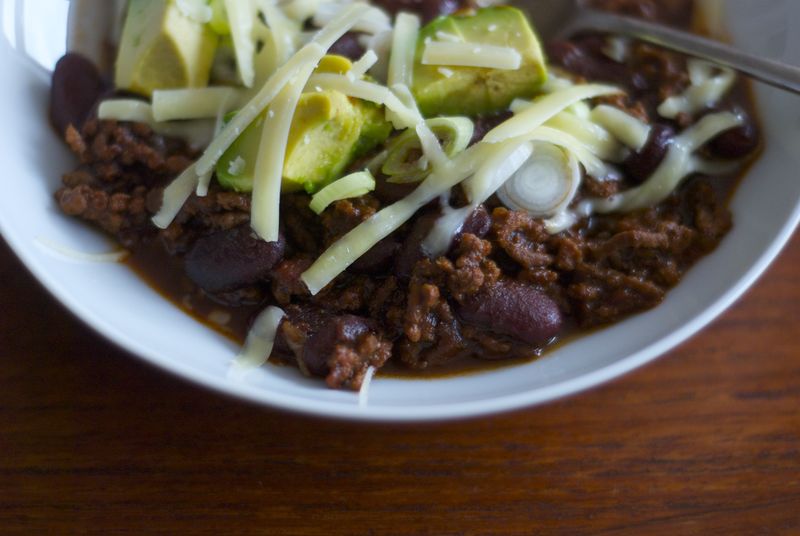
Photo courtesy of thewednesdaychef.com
4. Seattle Dogs
A carry-over from the 1990s grunge era, cream cheese and sauteed onions define these wholly Seattle creations. Here’s how to make your own at home.

5. Bacon-Wrapped Jalapeno Poppers
Need we say more? Click here and let the magic begin.

Image courtesy of allrecipes.com
6. Ivar’s Clam Chowder
A Seattle legend and oh so good for those rainy day games. Dive in!

Image courtesy of geniuskitchen.com
7. Hawk Shots
Fun, festive and easier then they look. This is how you do it.

8. Slow Cooker Pulled Pork
Root beer is the secret to this culinary gem. Yummy in a sandwich, or eat it right out of the crock pot all by itself…we won’t tell. Here is the scoop on how to make it.

Image courtesy of allrecipes.com
9. Avocado and Black Bean Dip
Surprisingly simple and delicious, this dip is also healthier than most. Grab some chips and check out the recipe.

Image courtesy of allrecipes.com
10. The Paseo Cuban Sandwich
For Seattleites who know the joy of Paseo sandwiches–or anyone who just loves good food–this recipe is well worth the extra effort.

Photo courtesy of The Seattle Times
11. Crab Rangoon
For those looking to go the extra mile, these tasty appetizers will be the talk of your party. Find the full rundown here.

Photo courtesy of allrecipes.com
12. The 12th Man Margarita
The quintessential Seahawks cocktail created by Elliott’s Oyster House. Now you can mix it at home and impress your friends.

Photo courtesy of lakeunionsearay.com
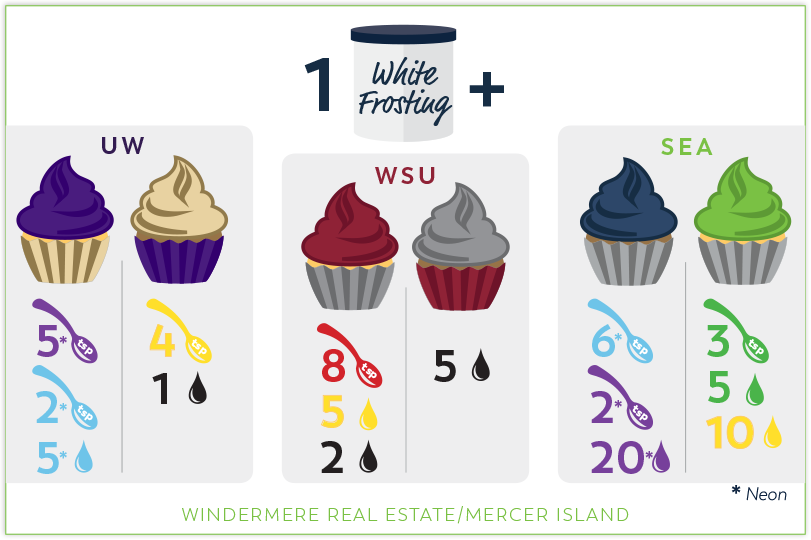
Bonus: Color Formulas for Team-Colored Frosting!

ABOUT WINDERMERE MERCER ISLAND
We earn the trust and loyalty of our brokers and clients by doing real estate exceptionally well. The leader in our market, we deliver client-focused service in an authentic, collaborative and transparent manner and with the unmatched knowledge and expertise that comes from decades of experience.
windermeremercerisland.com | (206) 232-0446 | mercerisland@windermere.com
2737 77th Ave SE, Mercer Island, WA 98040.
© Copyright 2018, Windermere Real Estate/Mercer Island.
Q2 2018 Seattle-Eastside Real Estate Report


Signs of transition to a more balanced market are becoming abundantly clear as we move further into 2018. Price growth, while still climbing in most areas, has tapered off and average market times are inching up. Brokers are beginning to dust off forms that have seen little use of late—finance and inspection contingencies—as buyers gain a stronger foothold at the negotiating table.
Some homes are still garnering multiple offers and commanding incredible prices and terms, but many more are seeing negotiations more equalized with fewer buyers at the table. Seattle has needed this return to balance for a very long time. It is likely that buyers who were beaten down and bruised over the past couple of years will return to the house hunt, but it will likely be on their own terms. Waiving all contingencies, releasing a substantial earnest money to the seller up front, and giving the seller a period of free possession after closing will be reserved for only the most coveted homes.
On the other hand, being able to conduct thorough due diligence on a prospective home over a comfortable period after offer acceptance is a buyer right that is returning to the picture. It has been a long time since that was even possible in the hottest neighborhoods. So long, it seems almost foreign. Yet that equalization of power is long overdue and needed to stabilize our market.
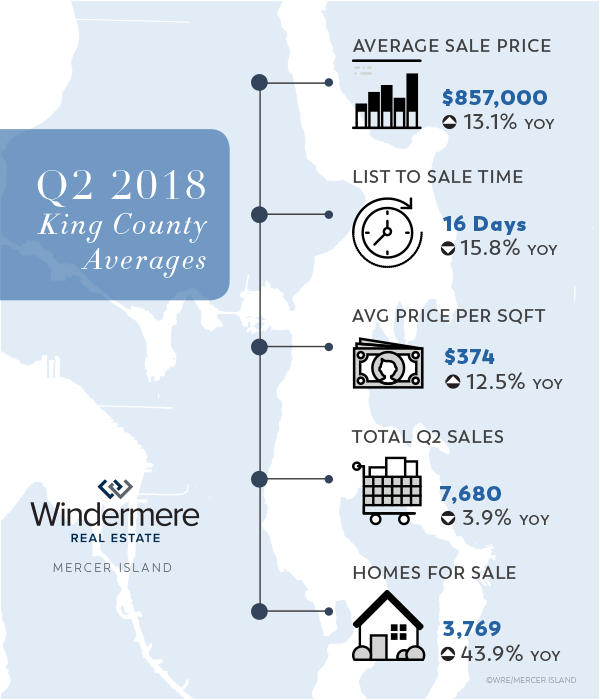
Overall median Q2 ‘17 to Q2 ‘18 prices in Seattle rose 11.3% to $801,000, while the Eastside rose 9.1% to $960,000. The average cost per home square foot was $459 in Seattle and $426 on the Eastside (which tends to have larger homes—2,752 square feet vs Seattle’s 2015 square feet—and thus a lower cost per square foot to construct).
Home mortgage interest rates have continued to rise, averaging 4.54% in Q2 putting continued pressure on buyers to purchase before they are simply priced out of the Seattle-Eastside market. Our region is entering a sweet spot where home prices are stabilizing and have likely peaked but interest rates are still affordable. Because rising interest rates have a much larger impact on the monthly mortgage than home price, values would have to fall pretty sharply to offset the impact of a 1-2% increase in mortgage interest rates.
SEATTLE

Up 20.7%, affordable Richmond Beach and Shoreline saw the strongest price growth in Q2 followed closely by Lake Forest Park and Kenmore at 19.4%. West Seattle, South Seattle, Madison Park/Capitol Hill, and Queen Anne/Magnolia all saw increases in the mid-teens. Surprisingly, Ballard-Greenlake and North Seattle—strong contenders in the past couple of years—slowed to 11.8% and 6.3% respectively.
Click here to view the complete report for a neighborhood by neighborhood breakdown of Average Sale Price, size, and number of homes sold.
EASTSIDE

Kirkland was the height of the storm on the Eastside drawing a median price gain of 30.6% over Q2 of last year. This was very loosely followed by Juanita/Woodinville at 14.4%, West Bellevue at 14.0%, and Redmond at 11.2%. South Eastside 7.5%, East Bellevue 7.4%, East of Lake Sammamish 6.9%, and Mercer Island 4.5%, all below the Eastside median, represented the fringe of Q2 appreciation.
Click here for the full report and neighborhood-by-neighborhood statistics!
MERCER ISLAND

Mercer Island, with only two homes priced below $1 million, struggles with the lack of affordability at mainstream price points. While the number of $1-2 million homes for sale is up sharply (46%), finally giving buyers more options to choose from, the pace of sales in that price point has cooled off as buyers wait for the perfect home. A glut of homes for sale in the $3-5 million range—up 67% over this time last year—has caused that segment of the market to stagnate. Homes in the $2-3 million and $5 million plus ranges have fared slightly better than their middle sibling. Mercer Island condos, the only affordable option on the Island, have soared in value with recent sale prices creating shock waves within the industry.
Click here to view the complete report for a neighborhood by neighborhood breakdown of Average Sale Price, size, and number of homes sold.
CONDOS – SEATTLE & EASTSIDE

The number of Seattle metro condos for sale has steadily climbed in Q2 while those available in downtown Bellevue have diminished. Condo prices have continued to outpace their residential counterparts as demand to affordably own vs rent at astronomical prices drives buyer interest. Seattle condos appreciated 20.4-34.6% in all but two markets, North Seattle up 5.6% and SODO/Beacon Hill down 4.5%. On the Eastside, condos were up 13.3-35.2% except for Kirkland up 8.2% and West Bellevue down 3.5%. Not included in these numbers are the newly underway Bosa 188 condos which have a significant number of pending sales that will not close until 2020.
Check out all of these factoids and more in the full condo report.
WATERFRONT

Seattle and Mercer Island have fewer waterfront homes for sale in Q2 this year than in either of the past two years. The Eastside is up very slightly while Lake Sammamish has more than three-fold the number of homes for sale over the same time. The highest closed sale in Q2 was a NW-facing 1937 Yarrow Point estate on 100 feet of waterfront and just over an acre of land for $10 million. The most affordable waterfront sale was a Ripley Lane 2003-built home with 140 feet of waterfront for just shy of $1.7 million.
Check out the full Waterfront Report for a complete list of waterfront home sales by address and community.
ABOUT WINDERMERE MERCER ISLAND
We earn the trust and loyalty of our brokers and clients by doing real estate exceptionally well. The leader in our market, we deliver client-focused service in an authentic, collaborative and transparent manner and with the unmatched knowledge and expertise that comes from decades of experience.
© Copyright 2018, Windermere Real Estate/Mercer Island. Information and statistics derived from Northwest Multiple Listing Service and deemed accurate but not guaranteed.
