 Facebook
 X
X
 Pinterest
 Copy Link
For more information on preparing to sell your home, visit my Home Selling Guide:

A home is the largest investment most people will make in their lifetime, so when it comes time to sell, homeowners often wonder what they can do to get the most return on their investment. Many have the misconception that remodeling is the way to go, but that isn’t always the case. Rather than going all-in on upgrading your home, you should know which home improvements are worth it, and which ones aren’t.
We’ve sifted through the research and come up with a quick list of five home improvements that’ll help buyers fall in love with your home when it comes time to sell.
1. Add a little curb appeal
Curb appeal is critical. As the name suggests, it’s the first thing buyers see when pulling up to the front of any home so it needs to be in nearly pristine condition.
Landscaping can go a long way for a minimal upfront investment. Six rounds of fertilizer and weed control will set you back about $415, but when it comes time to sell, you’ll see a return on investment (ROI) of about $900 according to a 2023 survey by the National Association of Realtors.
Other improvements you can easily make to your curb appeal include:
2. Convert your HVAC to an electric heat pump
According to the 2023 Cost vs. Value Remodeling Report, replacing an oil or gas furnace with an electric heat pump is one of the hottest trends (and offers an unusually high ROI of 104%). Their earth-friendly efficiency is especially appealing to younger buyers and those concerned about climate change. Additionally, they offer summertime cooling, which is a big bonus in the PNW given our recent hot and smoky summers!
3. Refresh your kitchen
While major kitchen renovations are costly and typically have low ROI, a little elbow grease and modest budget can give you big bang for your buck (see our article on simple kitchen makeover ideas).
Here are some smaller updates to boost your home’s value:
4. Go green
Today’s younger generations are embracing eco-friendly living, and millennials are leading the pack. According to the National Association of Realtors’ 2022 Home Buyer and Seller Generational Trends Report, millennials make up the largest segment of buyers, holding strong at 43 percent of all buyers.
When it comes to attracting buyers who are willing to pay top dollar, going green makes sense. A Nielson study found that, of more than 30,000 millennials surveyed, 66 percent are willing to shell out more cash for conservation-conscious, sustainable products. Depending on where you live, consider installing solar panels, wind turbines, and eco-friendly water systems.
No matter where you live, attic insulation replacement and weather stripping are safe bets. Attic replacement costs can vary but typically have a good ROI. Weather stripping costs about $350 if you hire a professional, but you can easily DIY for a fraction of that cost.
5. Install hardwood floors
Installing or upgrading hardwood floors is pretty failsafe as most buyers love it. Ninety-nine percent of real estate agents agree that homes with hardwood floors are easier to sell, and 90 percent of agents say that they sell for a higher sale price, according to the National Wood Flooring Association. Similarly, a survey by the National Association of Home Builders (NAHB) found that wood flooring was among the top 10 home features most desired by home buyers.
When it comes time to sell, I will help you get the highest possible ROI for your home. I can connect you with tried-and-true contractors, suggest strategic upgrades, and help you develop the right pricing plan based on up-to-the-minute market analysis. Reach out for a complimentary home value consultation.
© Copyright 2023, Windermere Real Estate/Mercer Island.
Adapted from an article that originally appeared on the Windermere blog November 12, 2018. Written by: Sarah Stilo with HomeLight.
Cost vs. Value data ©2023 Zonda Media, a Delaware corporation. Complete data from the 2023 Cost vs. Value Report can be downloaded free at www.costvsvalue.com.

We earn the trust and loyalty of our brokers and clients by doing real estate exceptionally well. The leader in our market, we deliver client-focused service in an authentic, collaborative, and transparent manner and with the unmatched knowledge and expertise that comes from decades of experience.

Help us give kids the confidence they need to start the school year right! My Windermere team and I invite you to participate in our Kicks for Kids back-to-school sneaker drive. It connects low-income youth in our local communities with new shoes for the upcoming school year. Through August 21st, we’ll be accepting donations 3 ways:

This year, we’re partnering once again with KidVantage (formerly Eastside Baby Corner), an amazing organization that helps kids thrive by providing resources and essentials with their 70+ partner agencies—many of which are school districts.
![]()


© Copyright 2023, Windermere Real Estate/Mercer Island.

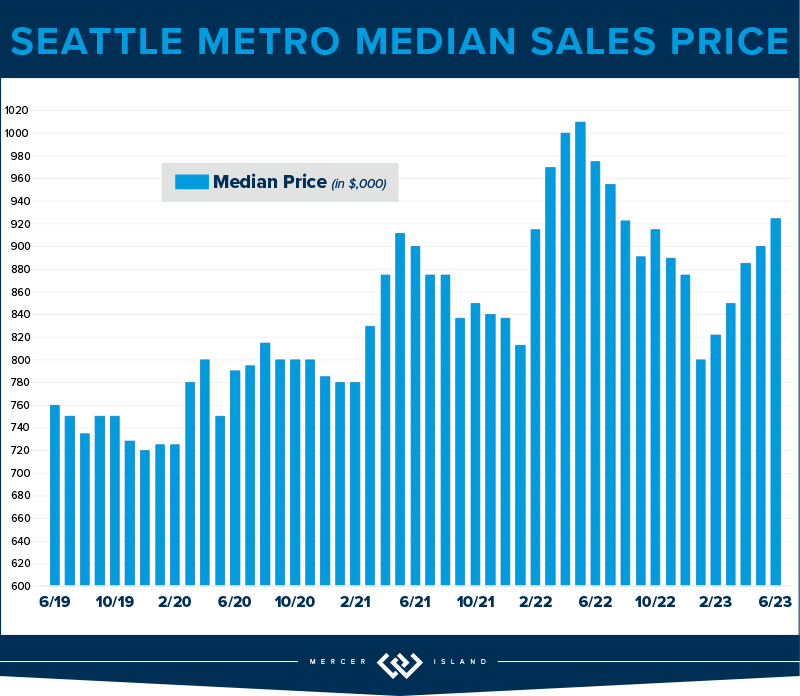
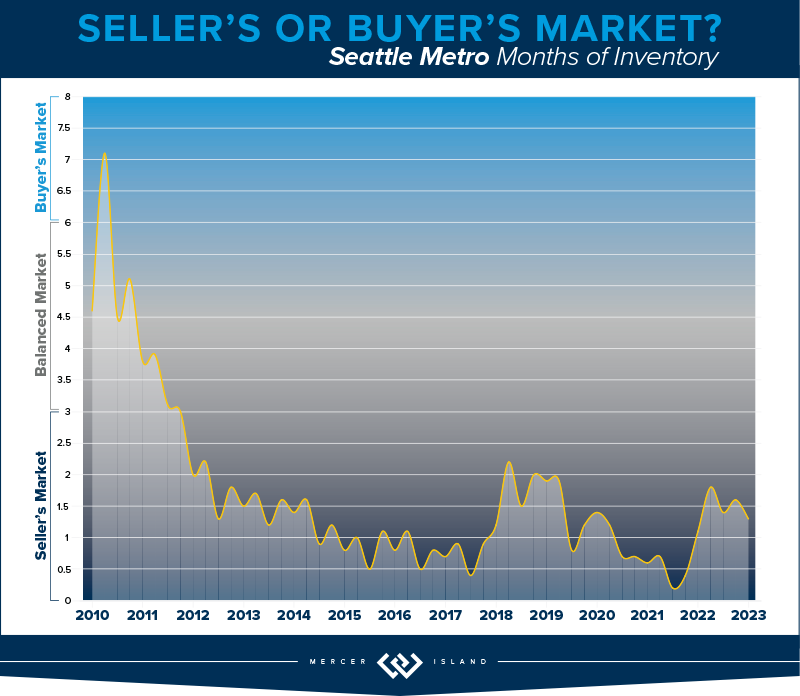
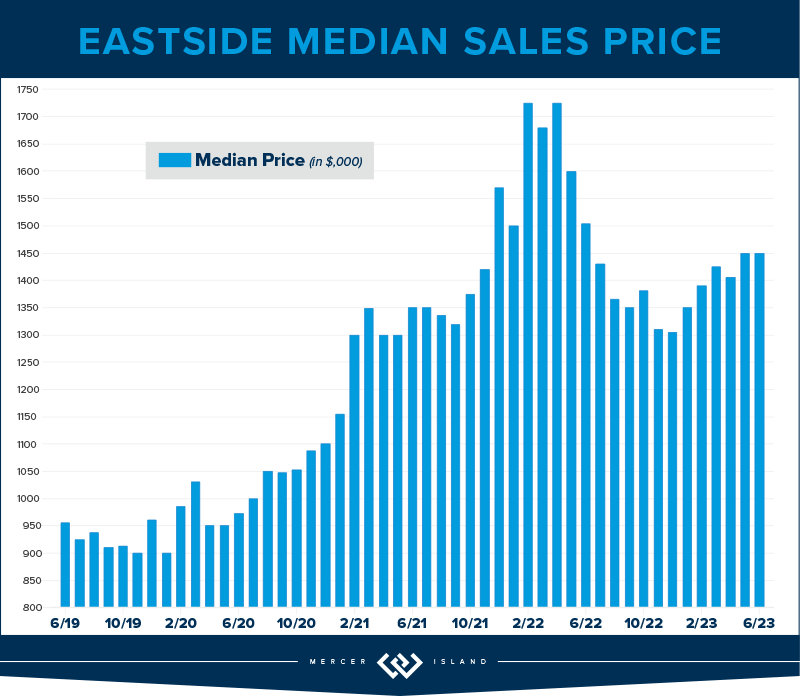
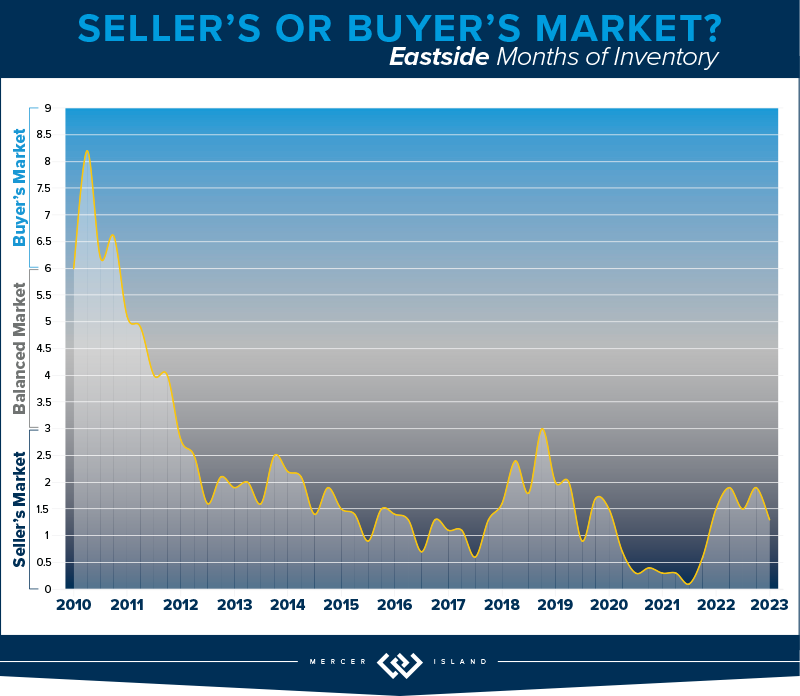
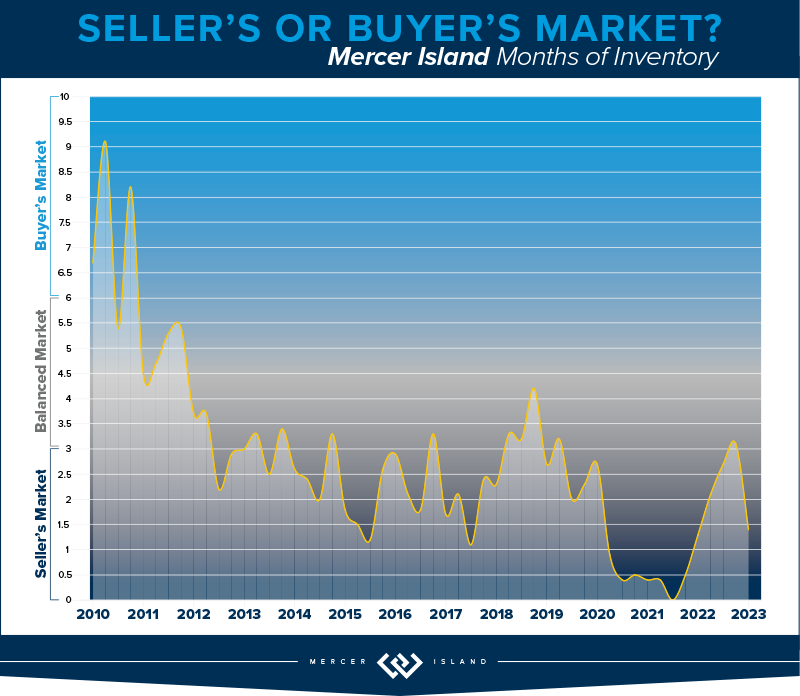
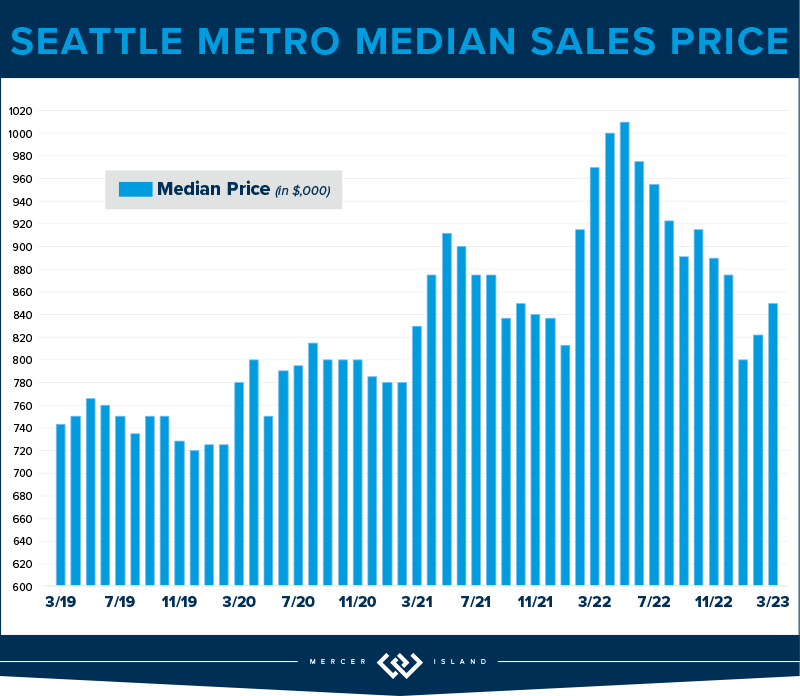
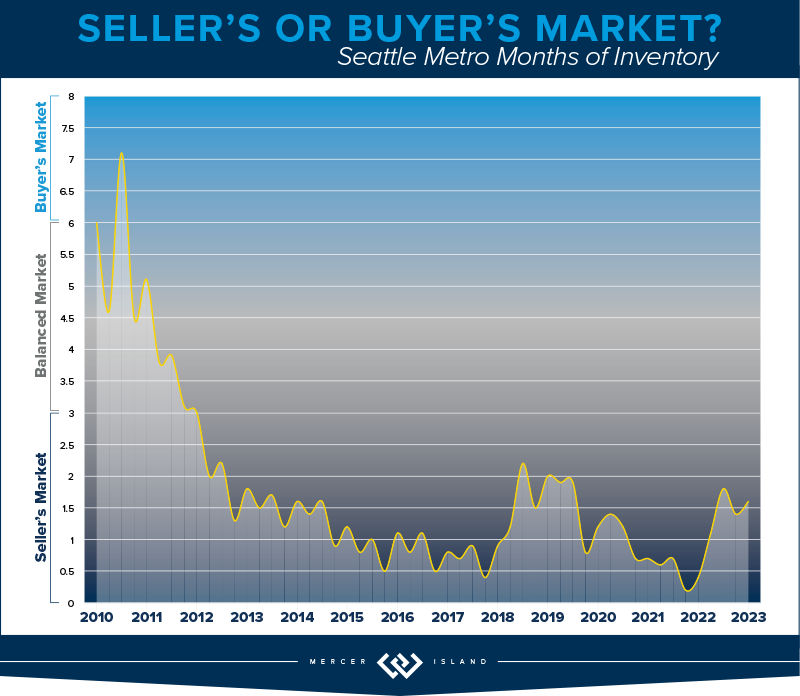
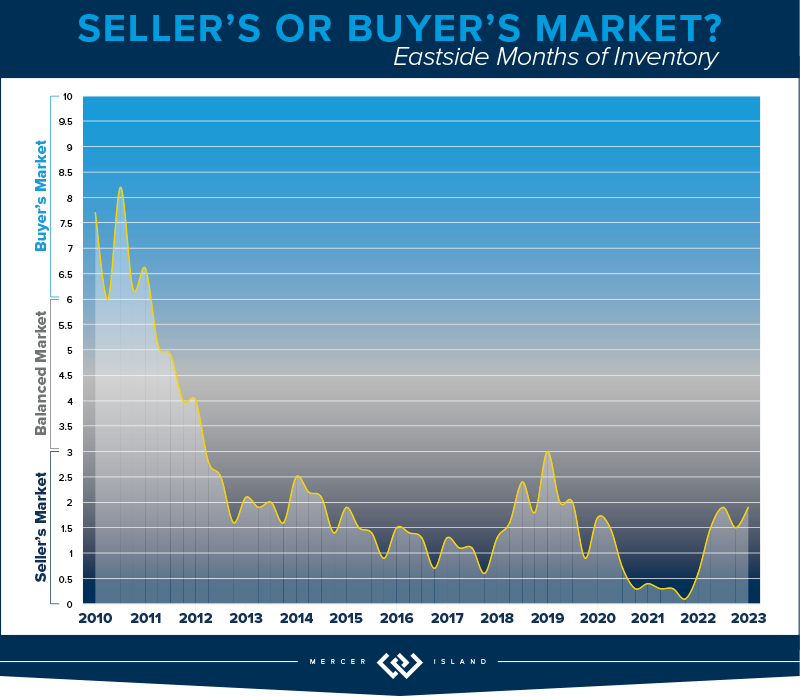
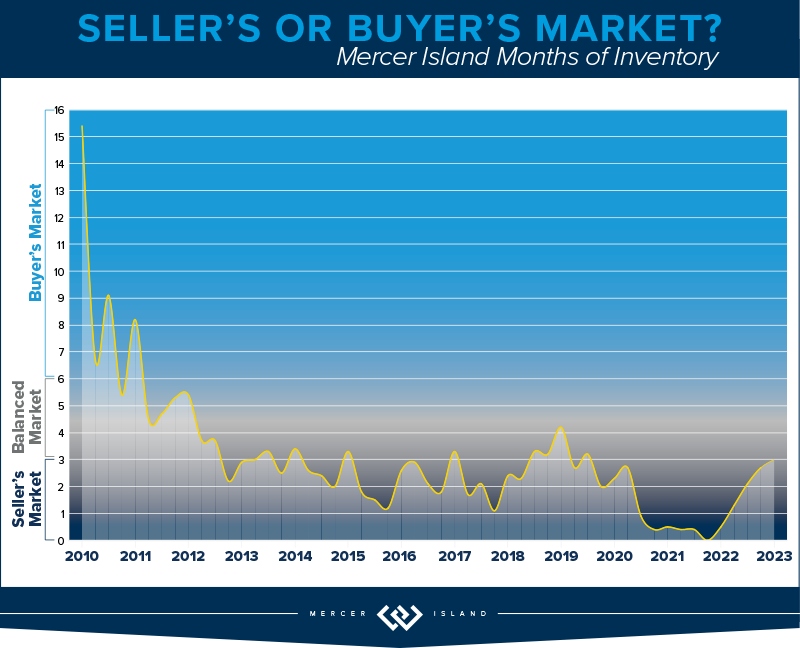
While median sales prices rose in Q2 compared to Q1, they were still down about 10% from last summer’s peak. Most areas saw fewer new listings and sales this year than we saw last year. Supply levels are still low enough to keep us technically in a seller’s market — our Windermere Chief Economist, Matthew Gardner, predicted this will continue, saying, “with relatively few homes on the market and the share of homes with price reductions dropping and list prices rising again, I just can’t see a buyer’s market appearing this year.”
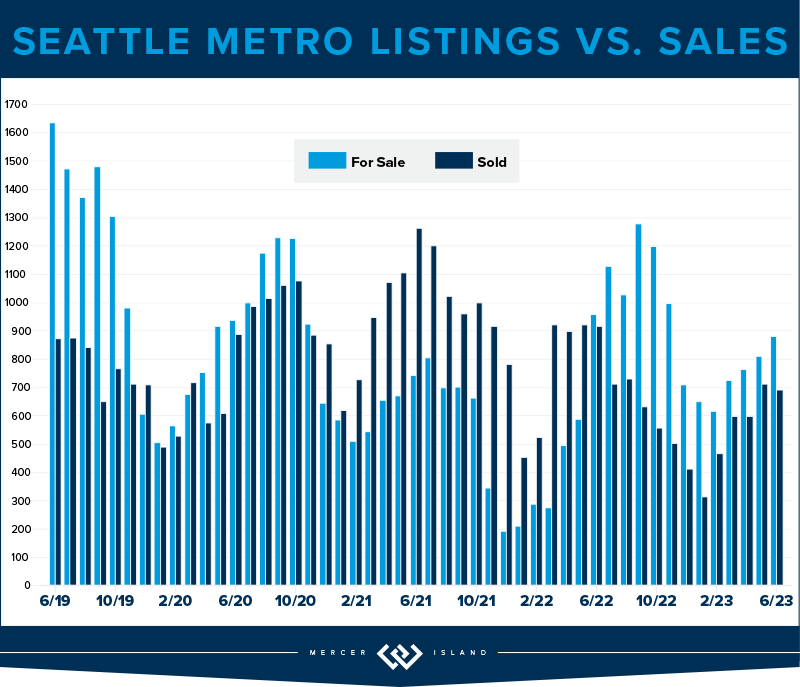
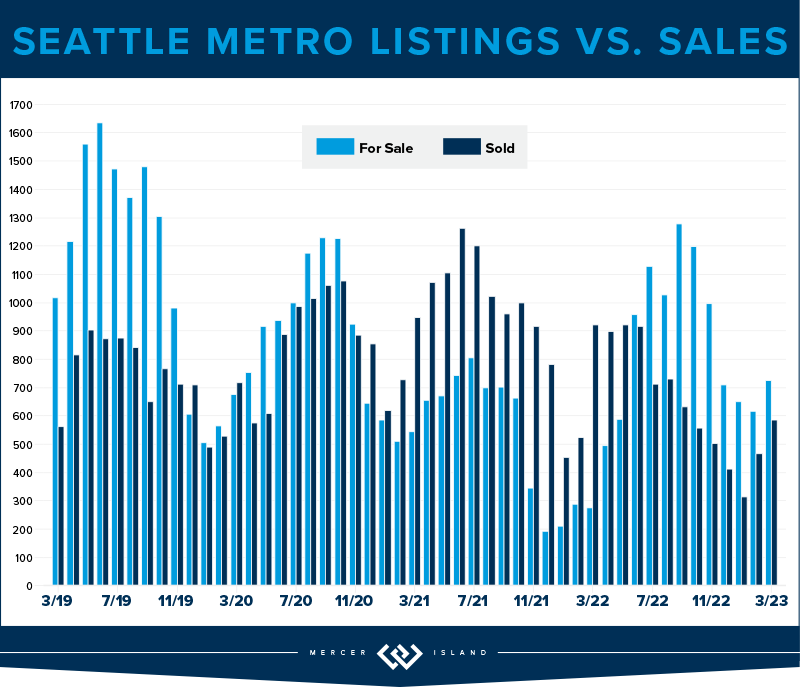
The Seattle market felt a similar adjustment as the Eastside with home prices down about 10% across the board. This spring market had a 27% drop in supply which limited the overall sales. The median closed sales price of $900,000 is up from May’s $830,000, but down 10% year over year offering some relief to buyers feeling the squeeze of high interest rates.
Last quarter, we mentioned keeping an eye on North Seattle and the growth we’ve seen in Shoreline, Lake Forest Park and Kenmore likely due to transit and those seeking affordability. Interestingly, 80% of the Lake Forest Park and Kenmore homes sold at or above their list price (in comparison to Queen Anne at 62%, for example) with prices rising 14% since last quarter but down 19% year over year.
Q2 closed with 879 active residential homes on the market, but no real sense of urgency from buyers (although the average days on market was 20 compared to the Eastside’s 23 days). The presentation of a home coupled with a smart pricing strategy equates to a positive outcome for sellers — we can see this in the 42% of homes that experienced multiple offers with an average boost of 6% over list price. With that said, 26% of Seattle contracts experienced a price negotiation between parties, so if you’re a motivated buyer and write an offer, you could benefit from more traditional contract terms.
Click here for the full report and neighborhood-by-neighborhood statistics!

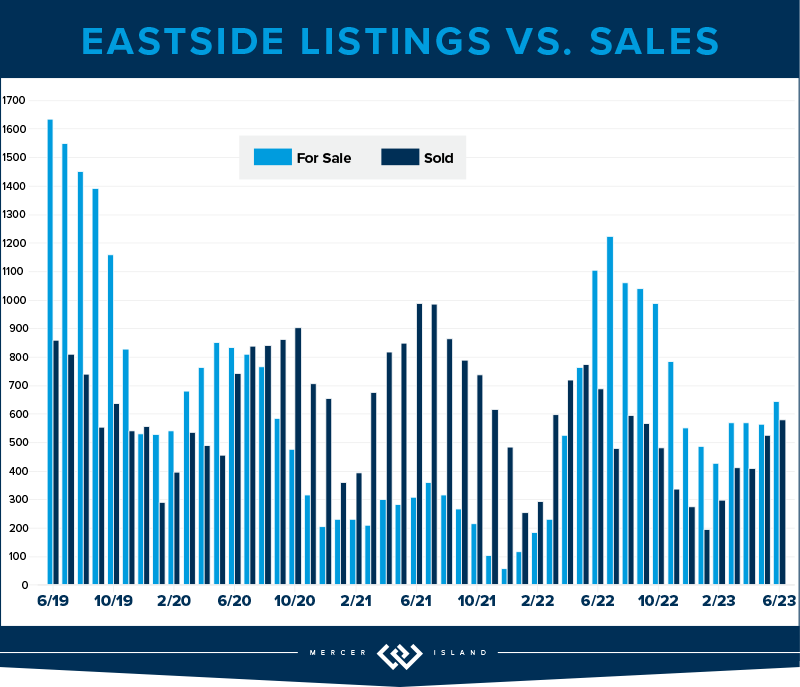
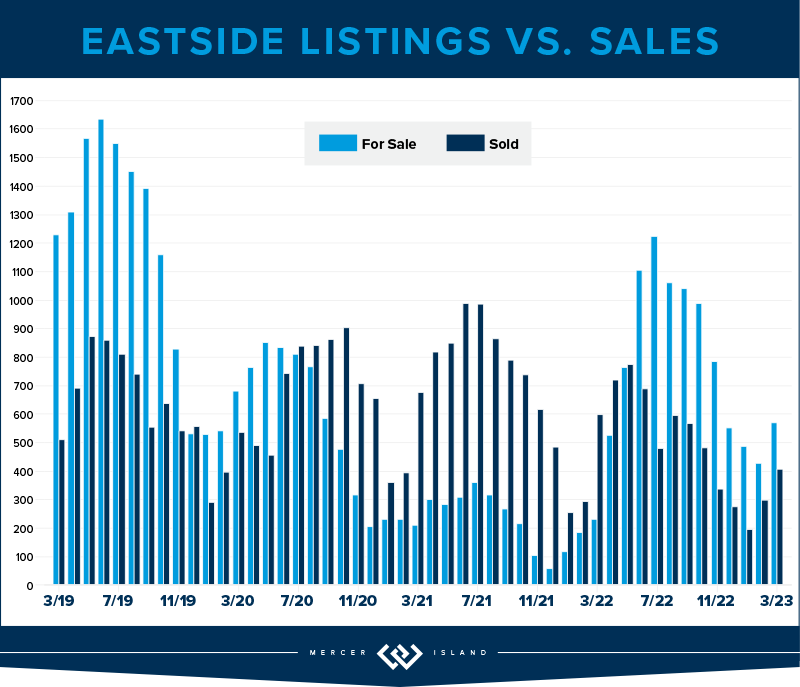
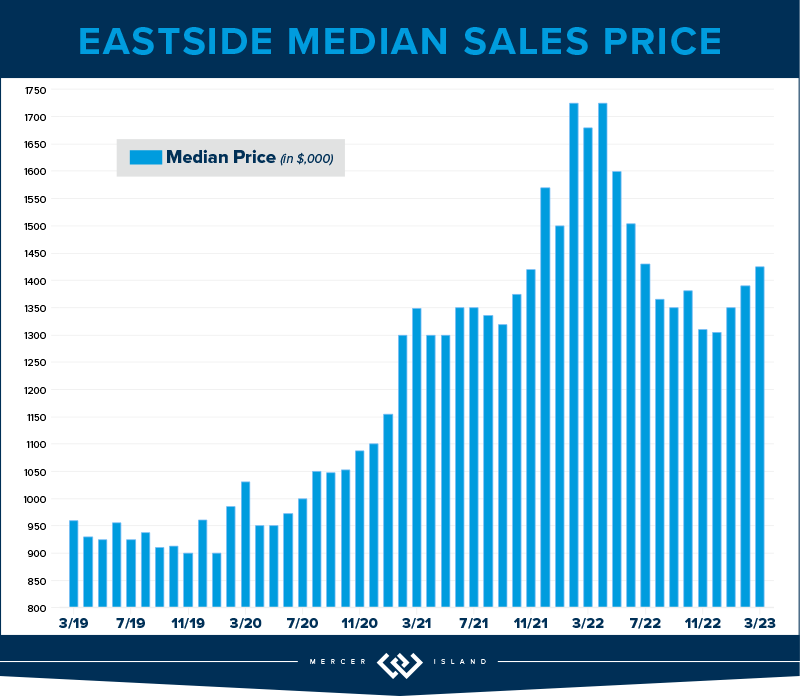
The Eastside residential market adjusted significantly this quarter. With a median price of $1,450,000 across all neighborhoods, this is an adjustment of 10% compared to last year. West Bellevue real estate, a luxury market, took the largest adjustment of 16%, down to an average of $996 per square foot. Market times were also slightly longer with 66% of homes selling within the first 10 days; the other 34% of homes had to be more patient in finding their buyer. This means that it took an average of 23 days for a seller to sell their property compared to 7 days at this time last year. However, this is much improved from 52 days in Q1!
Just like Redmond’s condos, its single family residential supply numbers were down 43%—but offered more supply than this time last year. Overall, there were 40% fewer listings than in Q2 of last year. With just 645 active homes available at the end of this quarter and rates closing out ~6.75%, low supply and high interest rates have kept sales stagnant. This time last year, there were 1,105 homes available for sale and rates had just moved across the 5% level.
It’s very true that sales are still happening and price and presentation from the seller matter most. On the Eastside, 39% of homes sold above their list price at an average of 5% over. Many buyers have adjusted their budget with the higher rates and seem motivated to get into the market now when the right home is found. If you can afford the payment, take the leap as a buyer. Sellers are motivated to accept more traditional terms, and you may not be competing amongst others.
Click here for the full report and neighborhood-by-neighborhood statistics!
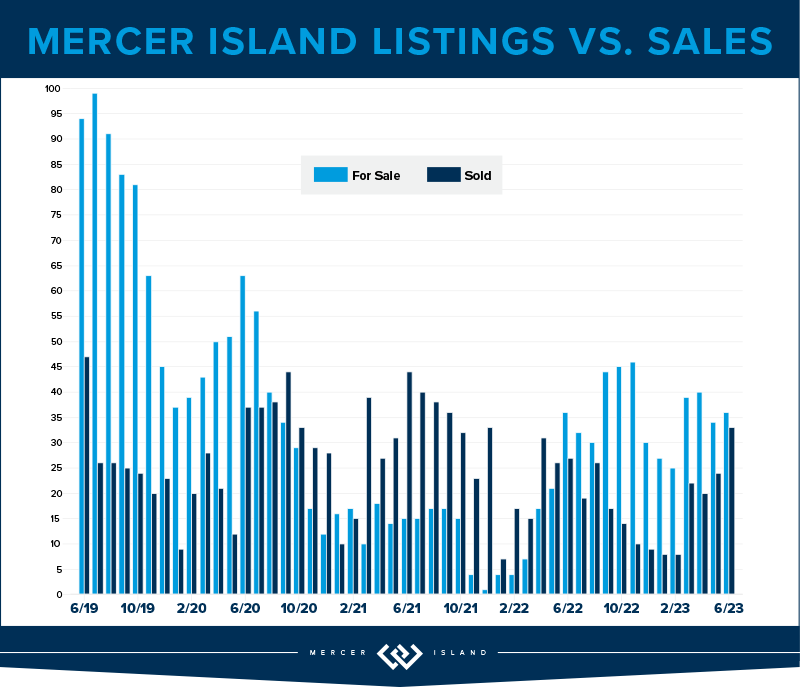
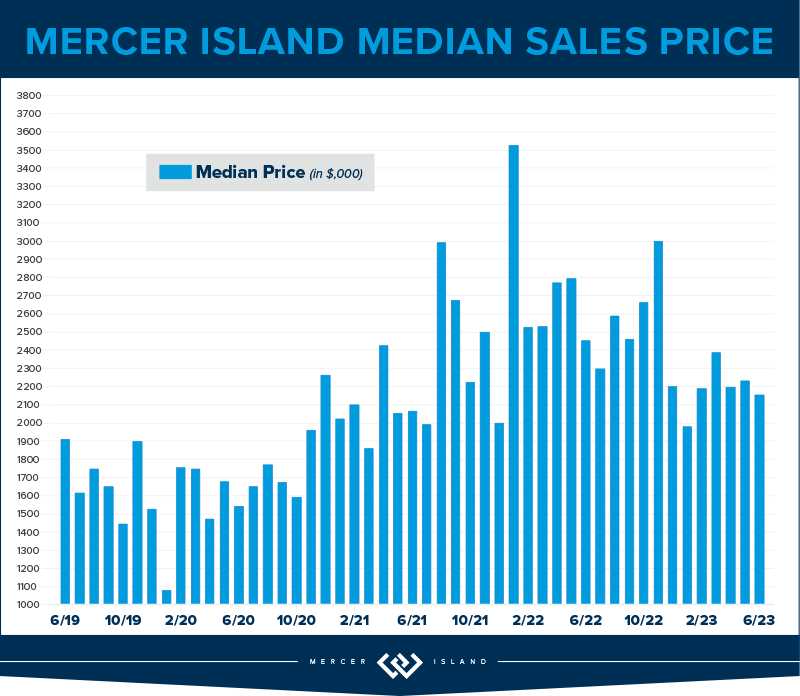
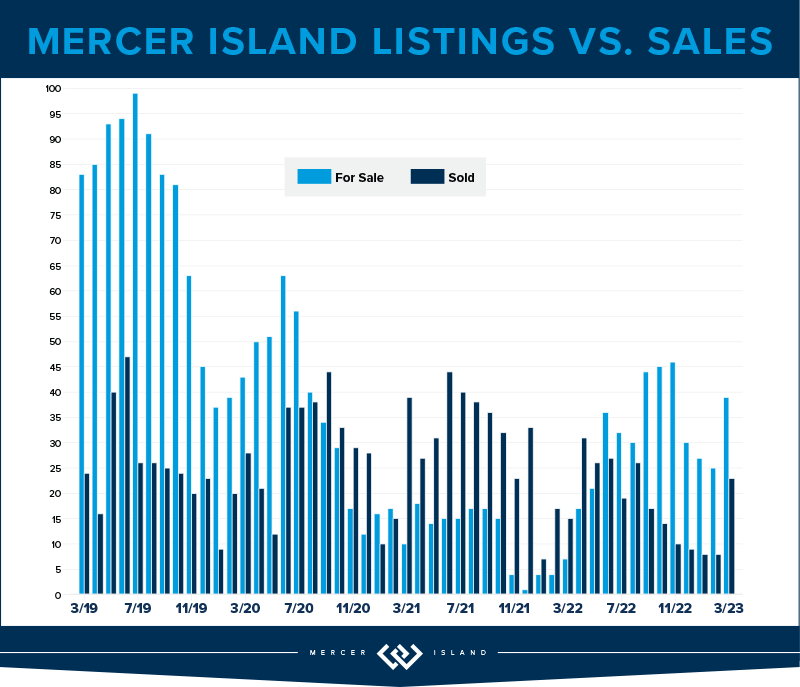
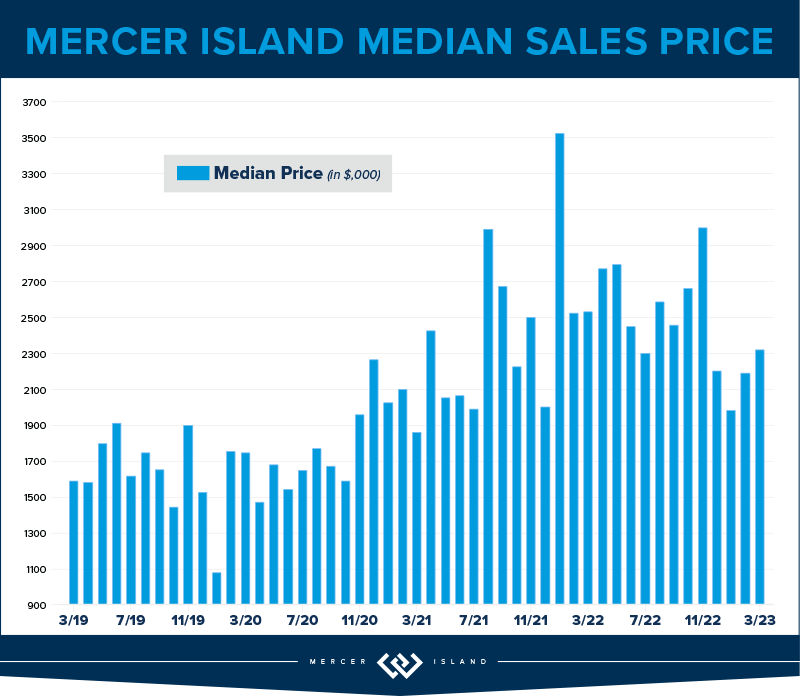
Much like other Eastside neighborhoods, Mercer Island made a significant adjustment in price—but one area of difference is that supply has remained steady. The south end offered the largest number of sold homes with 20, followed by 16 sold homes mid-island and 12 sold homes on the north end. Mid-island pricing continues to be smack in the middle with an average median sales price of $2,249,000; 75% of mid-island homes sold at or above their listing price, evidence that the desirability of being tucked away from freeway and amenities while still accessible to all is very appealing. Overall, island pricing has adjusted by 19% year over year to a median of $2.2 million compared to $2.7 million this same time last year.
There are currently 36 active homes on the market at the end of this quarter, which is identical to our supply level Q2 last year! This is up slightly from 39 active homes at the end of last quarter. The island is also feeling the pause in demand and urgency and that’s evident in the days on market numbers. Average days on market was 31 this quarter; it only took 7 days to sell your home this time last year. The inventory of homes for sale continues to be unique and striking, and a great pricing strategy equates to both happy seller and happy buyer.
Click here for the full report and neighborhood-by-neighborhood statistics!

For first time homebuyers, condos are still a fantastic starter purchase, whether you want to invest, live in the city or in a more suburban environment. We didn’t experience the same urgency with condo buyers this Spring likely because of interest rates, the fear of tech layoffs, or the transition from remote work to office work.
Year over year, neighborhoods like West Seattle, North Seattle, Queen Anne and Ballard saw strong price gains while South Seattle and Capitol Hill took a 20% median price adjustment. While it’s tough to find a direct correlation for neighborhoods tracking significantly different than others, the price gains are likely due to supply issues in these popular neighborhoods. On the flip side, price adjustments could be a sign that sellers had higher expectations of price before correcting to a normal level with a reduction or negotiation. There were 565 units available at the close of the quarter, down from 605 active units at the close of Q2 last year. Sellers are likely staying put for now, or they are investors with a low interest rate mortgage. Lake Forest Park and Shoreline condos triumphed over others with 81 percent of the 16 total condos selling at or above their list price; 70% of these units sold within the first week.
On the eastside, East Bellevue and East of Lake Sammamish had rising median prices with an average increase of 6% year over year, while other eastside neighborhoods adjusted downward. Redmond condo supply was down 41 percent! Again, this number reflects sellers staying put and with current interest rates hovering around 6.5% today, there may not be a suitable option for them to consider “trading up” to a larger unit or a single family home. With lack of supply and high rates, total sales are stagnant.
Check out area-by-area details the full condo report.

Most of the waterfront sales this quarter happened in Seattle with 14 sold homes compared to 6 sold homes last quarter. Just two Mercer Island waterfront properties, located on the north end, sold this quarter (the same number of sales as last quarter!) one with significant competition selling $750,000 above its listing price in just four days. In regard to eastside waterfront homes, while there was just seven sales (also the same number of sold homes as Q1 this year), four of those homes sold in five days or less including a $14m waterfront property on Hunts Point.
This brief overview of the entire Seattle-Eastside private waterfront market, including Mercer Island and Lake Sammamish, illustrates the trends occurring in our region over time. This data is interesting and insightful but cannot replace an in-depth waterfront analysis with your trusted professional.

© Copyright 2023, Windermere Real Estate/Mercer Island. Information and statistics derived from Northwest Multiple Listing Service and Trendgraphix, and deemed accurate but not guaranteed. Mercer Island cover photo courtesy of Cynthia Schoonmaker and Clarity Northwest Photography. Eastside cover photo courtesy of Joe Liu and Clarity Northwest Photography. Condo cover photo courtesy of Team RAREnorthwest and Elevato Photography.

When it comes time to sell your home, first impressions are crucial. Improving your curb appeal will catch buyers’ attention and go a long way toward selling quickly and for the best price. Here are seven affordable changes you can make that have a big impact…
A healthy, well-tended lawn will make your home look even more impressive when you start hosting open houses. Clean up all weeds, leaves, and debris, and consistently water to give it that fresh green look. Mow regularly, but not too short or you’ll damage the grass and invite weeds (experts recommend a minimum 3″ height for the Pacific NW). Consider a nitrate-rich fertilizer to keep the grass extra lush and green.

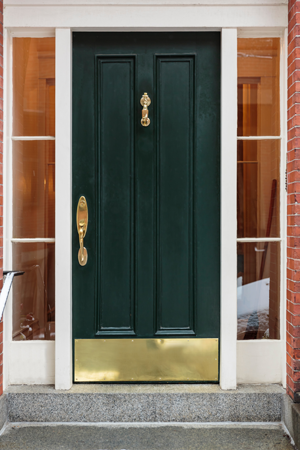
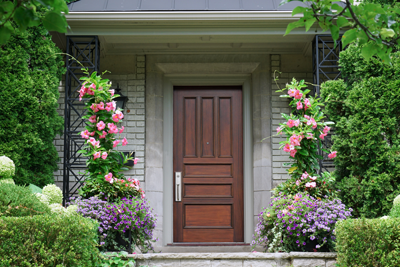
Your front door is an opportunity to make a tasteful statement. Look at bold color choices that are within or slightly stretch your home’s exterior color palette. Take time to prepare the surface for a fresh coat of paint to make the color pop as much as possible and try stylish doorknob options that accentuate the aesthetic to give your door some added flair.
New and stylish house numbers are an easy, eye-catching addition to how your home is perceived by buyers. Look for styles that match with your exterior color palette and any exterior lighting fixtures.

Adding colorful variety to your front yard will grab buyers’ attention. Align smaller plants like ground cover and flowers neatly within your flower beds, aiming for symmetry when possible. Use larger plants and trees to frame in your entryway or walkup. If your front yard doesn’t have flower beds, try adding hanging planters or window boxes. Because you’ll be competing against nearby listings, it’s landscaping projects like these that can make all the difference in your listing photos.
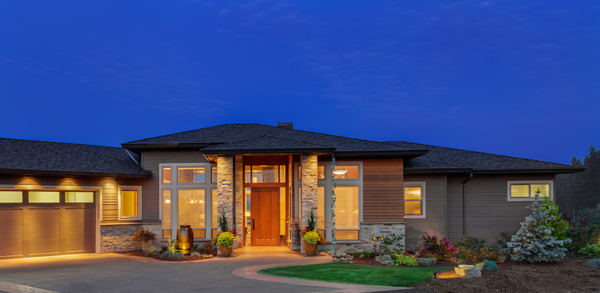
Adding landscape lighting will boost your curb appeal during nighttime, accentuate your shrubbery, and add a welcoming touch for potential buyers, lighting the way to your door.
While we’re on the subject, make sure your house lights are functional. Consider replacing dated fixtures with stylish new versions. Features like automatic dawn-to-dusk sensors will also come in handy if the home will be vacant while it’s listed.
Pressure washing your walkways and driveways can instantly improve your curb appeal. If buying a pressure washer is outside your budget, explore rental options from hardware stores in your area.

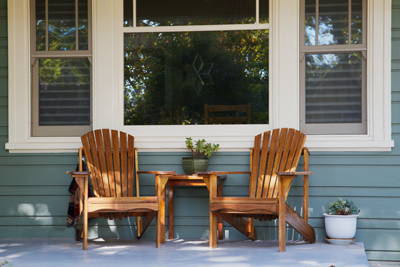
Incorporating classic front porch elements like a porch swing, sitting bench, and other outdoor furniture gives a welcoming aura to your home’s entry and creates a sense of comfort for prospective buyers.
Adapted from an article that originally appeared on the Windermere blog April 19th, 2023. Written by: Sandy Dodge.

We earn the trust and loyalty of our brokers and clients by doing real estate exceptionally well. The leader in our market, we deliver client-focused service in an authentic, collaborative, and transparent manner and with the unmatched knowledge and expertise that comes from decades of experience.
© Copyright 2023, Windermere Real Estate/Mercer Island.

When you’re ready to buy—or maybe just ready to start seriously thinking about it—there’s a lot you can do to prepare. Here is a checklist to help you get started…
Step one is finding out your budget for your new home. The best way to do that is to meet with a mortgage professional who will review your income, assets, and credit history in order to pre-approve you for a loan. Not only does getting pre-approved allow you to narrow your home search, but it also makes your offer stronger when it comes time buy. If you don’t currently have a mortgage professional, I would be happy to recommend one.
You can also use my Home Monthly Payment Calculator to experiment with different principal amounts, interest rates, down payments, taxes, and insurance to get an idea of what you can afford. Keep in mind that these calculations are meant to be estimates—interest rates change weekly and will be determined by your credit score.

Imagine your ideal home. How many beds/baths does it have? How big is the backyard? How close is it to the local park? Use our Wish List to guide you in your search online and with me.
Once you know how much you can afford and what you’re looking for in a home, it’s time to start your search. My online search tool makes it easy to search for homes, keep track of your favorites and subscribe to property alerts when a fitting listing hits the market in your area. I can also send you potential homes and take you to tour them in person once you’re ready to get serious.
As you prepare to buy, knowing what not to do can often be just as helpful as knowing what to do. By understanding the pitfalls buyers can fall into, you can identify the signs of these common buying mistakes ahead of time. Check out this article on buying homes that have been flipped, too.

Once you’ve found the home you can see yourself living in, what’s next? There are many steps to go through before you can officially call yourself a homeowner. I will guide you through this process, but in the meantime, here’s a preview of what you can expect.
When making an offer on a home, I will negotiate on your behalf in order to attain the best terms for you. This can include negotiating the price, repair costs, timelines, and contingencies.
This is the legal contract you and the seller will enter into once your offer has been accepted by the seller. It outlines the terms and conditions of the sale and is signed by both parties.
Once the Purchase and Sale Agreement is signed, a home inspector is hired to examine the home’s health, safety, and major mechanical systems. If any issues arise from an inspection, you may be able to renegotiate.
In a competitive offer situation where you wish to waive your inspection contingency in order to make your offer more appealing, I may advise you to conduct a “pre-inspection”—that is, an inspection that is conducted before you put an offer in on the house.
After your offer is accepted, the next step is to get final loan approval. During this process the lender will decide if they’re willing to approve your mortgage based on things like your creditworthiness and the title history and appraisal of the home you want to buy.
This is a report for you and your lender detailing the history of the home you’re buying to ensure there are no legal barriers to purchasing it.
Escrow is an impartial third-party process in which documents and funds are deposited by buyers, sellers, and lenders to facilitate the closing of a transaction. To learn more, read this short guide to understanding escrow.
During this final step of the home buying process, ownership is transferred from the seller to the buyer, closing costs are paid, and several legal documents are prepared and signed, all leading to the closing date. After closing is finalized and recorded and the funds are disbursed, the home is yours!
Check out my printable Moving Checklist as you get ready for the big day.
© Copyright 2023, Windermere Real Estate/Mercer Island.

To reduce your carbon footprint, increase your household’s sustainability, and add value to your property, solar power may be right for you. Understanding how solar works and how to maximize its benefits are key first steps in your journey to becoming a solar energy-producing household.
The technology that turns your house into a solar energy-harnessing hub is called photovoltaics, more commonly known as PV. PV works by fielding direct sunlight and absorbing its photons into the solar panels’ cells, which then creates electricity that provides energy for your home. This energy reduces your home’s output of carbon and other pollutants, which translates to cleaner air and water.
With the sun as your power source, the majority of the power generation occurs during the middle of the day, making summer the highest producing season. Rooftop panels work best when they are exposed to sunlight, free of shade or shadow from nearby trees or structures. Given the sun’s east-to-west path, south-facing roofs are best-suited for maximizing your solar power. To see if your roof is set up for success, consult a mapping service or solar calculator to establish your roof’s suitability. If your roof isn’t up to standard, you can explore alternatives such as ground mount solar installations and community solar gardens.
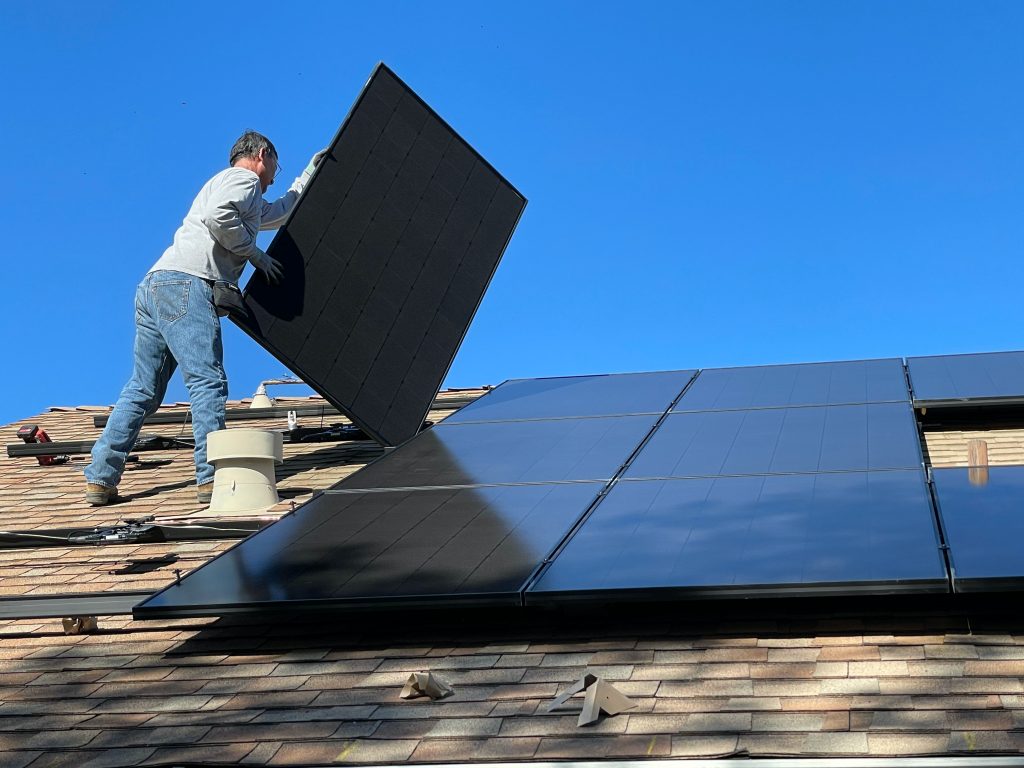
Photo source: Pexels. Photo Credit: William Mead.
Sustainability: Having a renewable source of energy coursing through your home reduces your household’s carbon footprint by converting a significant portion of your home’s energy to solar power.
Save Money: How much money you save by going solar depends largely on how much energy your household consumes and the energy output of your solar panels. The cost of solar power has steadily decreased over time, so you are more likely to save as time goes on. For information on state incentives and tax breaks, explore what options apply to your home by visiting DSIRE (Database of State Incentives for Renewables & Efficiency®).
Utilities: Whether your utility company charges a flat rate for electricity or charges variable rates throughout the day based on electricity production—i.e., higher rates in the afternoon, lower rates at night—solar power offsets the price you are charged for electricity. It becomes even more valuable during those higher-rate periods or during seasonal fluctuations in utilities costs.
Sell Solar Power Back: Homeowners can sell their solar energy back to utilities through “Net-metering” plans. When your power generation rate is greater than your household’s consumption rate, the end result on your electric bill is a net energy consumption. Refer to DSIRE for region-specific regulations and policies.
Home Value: Studies have shown that buyers are willing to pay more for homes with solar panels. The Appraisal Journal, published by the industry-leading appraisers association The Appraisal Institute, found that homes with solar PV systems increased their home value by $20 for every $1 saved on utility bills annually.
Although the right solar solution looks different for each household, what remains true across the board is that solar power creates more sustainable homes while increasing home value. Taking all this information into your solar power plans will help to improve your home’s renewable energy output and reduce your carbon footprint.
Article originally appeared on the Windermere blog, May 1, 2023, by Sandy Dodge.

The first quarter of 2023 saw a price correction compared to last year’s spike, with year-over-year median prices down by 9% in Seattle and 14% on the Eastside. That being said, prices are already beginning to climb again with steady growth since the beginning of the year. Buyer demand remains strong despite higher interest rates—competitively priced, well-presented homes are still fetching multiple offers.
For those who purchased a home in Seattle this quarter, it likely felt like there were more options and inventory with a minor rebalance on price. While transactions were down 28% year over year, we also saw median sales price was down from $925,000 to $830,000 since last quarter, which is a 9% adjustment. A down correction in pricing gave relief to buyers feeling the pinch and stress of rising interest rates to 6.5%. Rates have doubled the past 1.5 years but, considering the limited supply of homes for sale, the drop in home prices hasn’t been severe.
Neighborhoods like Lake Forest Park saw growth in their number of transactions (up 15%); other neighborhoods like Madison Park and Capitol Hill had nearly half the homes for sale compared to last year. It’s no surprise that as interest rates rise and affordability changes, buyers are casting a wider net to other parts of Seattle to the north. Keep an eye on neighborhoods like Shoreline, Kenmore and Lake Forest Park. Desirable prices paired with accessible transit is a bonus for those who are being asked to return to the office.
Multiple offers are apparent in some neighborhoods (price & presentation is key!) and we did experience 30% of homes sell above their listing price. If the shortage of inventory remains and interest rates drop slightly, we could see the frequency of multiple offers increase.
Click here for the full report and neighborhood-by-neighborhood statistics!

The Eastside was struck by job layoffs in the tech sector, rising interest rates and new property listings (28% more homes than last quarter!) but pending sales remained low compared to the previous year. Transaction volume was much like Seattle’s, with a decline of 22%. Mercer Island was the only community that stayed steady (no increase) in the number of transactions year over year.
Interestingly, while prices are down to a median of $1,400,000 year over year, this is a slight 2% increase from last quarter’s median of $1,380,000. 20% of the properties on the Eastside also sold above their listing price (most of these homes were in Bellevue) while sellers needed a shift in expectations with a whopping 58% of homes needing a price improvement to find their buyer. The list price vs. sold price percentage was 97% which means if you were a seller who listed your home at $1,000,000, you would expect to sell for $970,000 this quarter. Again, price and presentation matter and 41% of sellers who did this well sold in the first 10 days.
Buyers who are shopping for homes on the Eastside continue to be hyper focused on the school districts, turn-key properties and are serious about locking in their interest rate now, with the hopes of refinancing later this year when economists predict rates could decrease. If rates drop below 5.5% coupled with low inventory levels, we could see the frequency of multiple offers increase.
Click here for the full report and neighborhood-by-neighborhood statistics!

Even though there were just 39 residential transactions on Mercer Island this quarter, that number has stayed perfectly steady year over year. Over half of these homes sold in the first 10 days on the market, which is no surprise as demand has stayed robust.
13% of listings sold above their listing price, but this wasn’t concentrated on a certain community; four homes located on First Hill, Mid-Island plus the South & North Ends respectively, each received multiple offers this quarter. Q1 of 2022 saw a median price of $2,540,000 with just one home listed under $1,500,000. This quarter, the median price is $2,233,000 (a 12% decline) while six homes sold under $1,500,000! Due to the decline in prices and a slower start to the year, many sellers needed a shift in expectations with a whopping 67% of homes needing a price improvement to find their buyer.
We haven’t seen the number of new listings in the double-digit figures since Q2 of 2022, and it’s very possible we won’t experience that same level of inventory this year. Baby boomers are holding onto their homes with the benefit of their remarkably low 2.75% interest rate, and families are staying put to finish out the school year.
Our advice still stands: if you’re thinking about waiting for lower rates AND lower prices, you might be dreaming. Enjoy the fantastic Island inventory now, lock in your rate and consider refinancing later this year or next spring when economists predict rates will shift down.
Click here for the full report and neighborhood-by-neighborhood statistics!

Seeing first time homebuyers come back to the market or considering an investment? Buying a condo in Seattle or on the Eastside is a fantastic opportunity, especially as many companies are calling their employees back to the office at least 3 days per week. It’s very possible transaction volume will be up next quarter, but for now, transactions were down 44% year over year. With that said, 465 units sold in Seattle; 347 units sold on the Eastside which isn’t all doom and gloom.
Just like North Seattle is heating up with residential sales, Lake Forest Park, Shoreline, Ballard and North Seattle condos outpace the rest of Seattle, up 10% on average. These areas are experiencing new construction townhomes that are especially desirable to first time homebuyers. Boutique builders are offering a trendy design palette (have you seen the Scandinavian-style design with light woods and sleek finishes?) paired with all the “bells and whistles” that city dwellers appreciate, like dog washing stations, artificial turf, and EV chargers.
For the Eastside, Redmond condos stayed the steadiest, down just 17% year or year. Kirkland was the only neighborhood to experience a price bump, up 11% to a median price of $693,000.
The Seattle condo median price has declined just 1% year over year to $515,000, while the Eastside experienced a 12% adjustment to $550,000. This is a $530,000 average when comparing both areas. With interest rates doubling the past 1.5 years and buyers considering a condo unit under the umbrella of a condo association, shoppers will be very particular about their monthly dues assessment and what’s included for those monies as both interest rates and dues have such a dominant effect on their overall buying power. Condos continue to be a necessary niche in our marketplace!
Check out area-by-area details the full condo report.

There were 17 privately-owned waterfront home sales in the greater Seattle-Eastside region in Q1 2023 (Eastside-7; Seattle-6; Lake Sammamish-2; Mercer Island-2). This is exactly on par with last year, when we also saw 17 sales in Q1 2022.
The highest sale was for a Medina Northwest Contemporary on 115 feet of low-bank waterfront that sold above list price for $20m. The most affordable waterfront was a unique triplex with 1920-1930 era beach cottages on a private boardwalk near the Ballard Locks—a buyer snagged it below list price for $1.9m.
This brief overview of the entire Seattle-Eastside private waterfront market, including Mercer Island and Lake Sammamish, illustrates the trends occurring in our region over time. This data is interesting and insightful but cannot replace an in-depth waterfront analysis with your trusted professional.

© Copyright 2023, Windermere Real Estate/Mercer Island. Information and statistics derived from Northwest Multiple Listing Service and Trendgraphix, and deemed accurate but not guaranteed. Mercer Island cover photo courtesy of Petra Varney and Clarity Northwest Photography.

When it’s time to sell a home, we all dream of a flawlessly executed transaction where everything goes smoothly and ends with a win-win for you and the buyer. Here are seven tips to help make that happen—and avoid surprise expenses along the way…
Making repairs to your home before you sell not only makes it more appealing to buyers, but it can also help you avoid the additional costs that can result from the buyer’s inspection. Disclosing any repairs that still need to be made will help you move smoothly to closing and avoid problems that could otherwise kill the deal. Consider conducting a pre-listing inspection to make sure everything is out in the open before you sell.
The key to selling your home quickly is to find the right buyers. To find the right buyers, your home must be correctly priced. I use a Comparative Market Analysis (CMA)—a thorough, data-backed examination of your home and how it compares to other listings in your area—to accurately price your home. Without an agent’s CMA, it’s easy for your home to be listed at the wrong price.
First impressions matter when selling a home. The vast majority of buyers are searching online and taking virtual tours of homes they’re interested in. As such, it’s well worth the time and money to hire a high-quality photographer and I always provide this for my sellers. The right photography can make all the difference in the minds of buyers.
Home staging is also a critical element for getting the most value for a home and selling it quickly. You can even DIY if you have the time and modern decor. It’s also the perfect time to inspect your home for any minor or cosmetic repairs that can be addressed quickly. An aesthetically pleasing home will attract more eyes, and any edge you can give your home over competing listings may be just the ticket to getting it sold.
Selling your home is an act of learning how to let it go. Once you know you’re ready to sell, you’ll need to be able to look at it with an objective eye. This will allow you to approach decisions from a neutral standpoint and work towards what is best for the sale of the home. Having clear judgement will also help you get through the negotiating process and steer yourself toward a smooth closing. Stepping back can be tough, but a good agent will always be happy to give you guidance and help you keep perspective.
It may be tempting to rush your listing to take advantage of local market conditions, but waiting until you have all your ducks in a row will make life so much easier. Knowing when to sell your home is a mixture of being financially prepared, having the right agent, and understanding how your home fits into the current local market landscape. Once you’re ready, here are some tips on timing the market.
…and I’m not just saying it because I’m an agent! Selling a home “For Sale By Owner” (FSBO) can save on commission fees, but is a complex and risky process that can easily lead to serious costs. An agent will help you front marketing costs, provide sound advice to help you avoid legal trouble, and ultimately shoulder some of the liability for the transaction. Being represented by an experienced professional will help you avoid mistakes during the offer process, negotiations, and closing that could otherwise be costly or jeopardize the sale. It’s no wonder that a vast majority of sellers choose to work with an agent.
Approaching buyers’ offers with an open mind will ensure you don’t miss any opportunities. Before the offers start to come in, it’s important to work with your agent to understand your expectations and strategize which terms and contingencies you’re willing to negotiate on. That way, you can quickly identify the right offer when it comes along. Showing a willingness to work with buyers will also keep them engaged and make sure you don’t leave potential deals on the table.
© Copyright 2023 Windermere Mercer Island.
Adapted from articles that originally appeared on the Windermere blog, November 22, 2021 & April 7, 2021, by Sandy Dodge.

Getting your home ready to sell can feel like a circus act. Without the right organization, juggling the countless moving parts involved in this stage of the selling process can take its toll. This is the perfect opportunity to create a checklist to keep yourself on track and within your budget. The following information will illuminate the key responsibilities you face as a homeowner as you prepare to hit the market.
We’ve included a comprehensive checklist below of the common tasks required to get your home ready to sell. It is also available as a downloadable pdf here:

This list of value-adding curb appeal projects will help to form buyers’ first impressions of your home and make your ever-important exterior listing photos stand out amongst the competition.
Not only will these interior projects get your house sparkling clean, but they’re also preparatory steps for staging your home and hosting open houses.
For more information on preparing to sell your home, visit my Home Selling Guide:
This article originally appeared on the Windermere blog June 29th, 2022. Written by: Sandy Dodge.
© Copyright 2023, Windermere Real Estate/Mercer Island.

If you are homeowner, make $58k or less per year, and are either age 61+ or retired due to disability, there is a good chance you qualify. You can even retroactively apply for the exemption for the prior 3 years!
Scroll down for details on this exemption plus 4 other property tax relief programs that King County offers.
In another county? Here is the full list of income thresholds for every county in Washington State, and here is another link to view the programs each county offers.
WHAT IS IT?
A reduction in King County property tax for seniors, people with disabilities, and disabled veterans.
WHO QUALIFIES?
or
or
YOU MUST…
INCOME LIMIT
WAYS TO APPLY
WHAT IS IT?
The ability for seniors & disabled people to defer unpaid property tax/special assessments, including back taxes for as long as you’ve owned the home. Deferred taxes + any accumulated interest then become a lien on the property until it’s repaid.
WHO QUALIFIES?
or
YOU MUST…
INCOME LIMIT
HOW TO APPLY
WHAT IS IT?
The ability to defer the second installment of your property taxes/special assessments (normally due October 31st) if you are a low-income homeowner. The deferred taxes plus interest become a lien on the property until they’re repaid.
YOU MUST…
INCOME LIMIT
HOW TO APPLY
WHAT IS IT?
Relief from tax increases caused by major additions or remodels.
YOU MUST…
HOW TO APPLY
WHAT IS IT?
Tax relief for property damaged by something beyond the owner’s control. Eligible properties receive a reduction of assessed value resulting in lower property taxes. In addition, taxpayers can receive an exemption to keep taxes lower for the 3 years after they rebuild.
YOU MUST…
HOW TO APPLY
We earn the trust and loyalty of our brokers and clients by doing real estate exceptionally well. The leader in our market, we deliver client-focused service in an authentic, collaborative, and transparent manner and with the unmatched knowledge and expertise that comes from decades of experience.
© Copyright 2023, Windermere Real Estate/Mercer Island.
